Resources
Books
Videos
Ajith
Follow the instructions given below to analyse the electoral bond data yourself. Knowing a bit of Python will be useful, but not a must.
All the cells will be executed.
You may now modify or add/modify code and execute them
The code inside first.ipynb directly gets the following files, from the website.
Python programming language is very easy to learn and has a rich collection of modules for applications in various fields. Modules like NumPy, Matplotlib and Pandas are very popular. Pandas is a Data Analysis Library
So far I have been using weather data from the website of Indian Materiological Department (IMD) to demonstrate Pandas. You can find those examples in this Document. Also I have used Python for generating question papers from a question bank.
But if you are learning Python to help you in getting a job, learning those examples seems to be less useful. No prospective employer knows about the skills and effort required for them. On the other hand, the effort required to match the donors and recipients of Electoral Bond data is well known. During an interview you can tell a prospective employer “see, I have done something using Python that would take three and a half months for a huge organization like SBI”. Does that sounds better? I am not sure whether it is going to help or not. Python has no Politics!!
This is purely an academic exercise to learn Python and Pandas. There is no guarantee about the correctness of the results. The intention is just to demonstrate how to analyse such data.
The files are on the Election Commission website. I have downloaded two files uploaded on 21-mar-2024, and renamed them as ‘purchasers.pdf’ and ‘receivers.pdf’.
They need to be converted into ‘CSV’ format first. Code for that is available on GitHub. The program pdf_to_csv.py is downloaded from there. I have modified the filenames. Executing this program, from the folder where the PDF files are kept, generates two .CSV files. You may view them using any speadsheet application like OpenOffice calc or MSexcel.
Code inside these files are explained below. The first one is pre-process.py, that does the following.
# pre-process.py

import numpy as np
import pandas as pd
import matplotlib.pyplot as plt

pdf = pd.read_csv('purchasers.csv')
pdf['ANcode'] = pdf['Prefix'] + pdf['Bond Number'].astype(str)  # make the alphanumeric code
pdf = pdf.set_index('ANcode')

pdf.rename(columns = {'Denominations':'Amount paid'}, inplace = True)   # rename 'Denominations' to 'Amount paid'
pdf['Amount paid'] = pdf['Amount paid'].apply(lambda x:float(x.replace(',','')))  # comma to dot
pdf['Amount paid'] = pdf['Amount paid'].apply(lambda x:x * 1e-7)          # convert to crores
pdf = pdf.drop(columns =['Prefix', 'Bond Number', 'Sr No'])
pdf.to_csv('eb-purchased.csv')

rdf=pd.read_csv('receivers.csv')
rdf['ANcode'] = rdf['Prefix'] + rdf['Bond Number'].astype(str)
rdf = rdf.set_index('ANcode')

rdf = rdf.drop(columns = ['Prefix', 'Bond Number', 'Sr No'])
rdf.rename(columns = {'Denominations':'Amount received'}, inplace = True)
rdf['Amount received'] = rdf['Amount received'].apply(lambda x:float(x.replace(',','')))
rdf['Amount received'] = rdf['Amount received'].apply(lambda x:x * 1e-7)  # convert to crores
rdf.to_csv('eb-encashed.csv')
As per the State bank of India submission to the supreme court, this is the most difficult part of the problem that would take three and a half months, matching the purchaser-receiver records. The objective is to find out “who gave Bonds to whom”. One feels a bit reluctant to trust a single line of Python code to manage a task that is estimated to take three and a half months. So, be warned, you are on your own
The first two lines load the two files. The third line combines the records, matching happens automatically because the Index of both records are the ‘Alphanumeric code’. After that we delete some columns that we are not interested in.
pdf = pd.read_csv('eb-purchased.csv', index_col = 'ANcode')
rdf = pd.read_csv('eb-encashed.csv', index_col = 'ANcode')
df = pd.concat([pdf, rdf], axis=1, sort = True)       # combine the purchaser / receiver records

# Delete the entries that we are not analysing. Uncomment these lines if you want them
df = df.drop(columns =['Reference No (URN)', 'Date of Expiry', 'Issue Branch Code', 'Issue Teller', 'Journal Date', 'Status' ], axis = 'columns')
df = df.drop(columns = ['Pay Branch Code', 'Pay Teller', 'Account no. of Political Party'], axis = 'columns')
Total number of Bonds purchased and total number encashed along with the amounts.
purchased = df['Amount paid'].sum()
print('Number of Bonds purchased = %d (Rs. %10.4f Crores)'%(len(pdf), purchased))
received = rdf['Amount received'].sum()
print('Number of Bonds encashed = %d (Rs. %10.4f Crores)'%(len(rdf), received))
print('Puchaser info issing for %d bonds (worth Rs. %10.4f Cr)'%(len(rdf)-len(pdf), received - purchased))
The output of this code is
purchaser details for 1550 bonds worth Rs. 613.5761 Cr is missing.
df["Name of the Purchaser"].fillna('Unknown', inplace = True) # if puchaser data is missing, show it as unknown
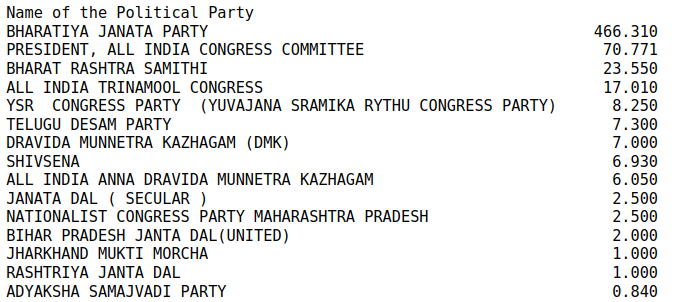
x = df[df["Name of the Purchaser"] == 'Unknown']
x.groupby(by='Name of the Political Party')['Amount received'].sum().nlargest(15)
The result looks like
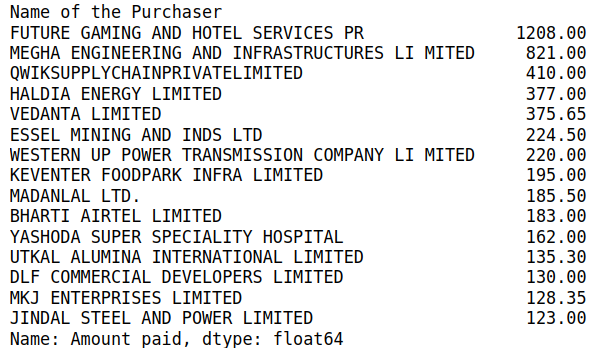
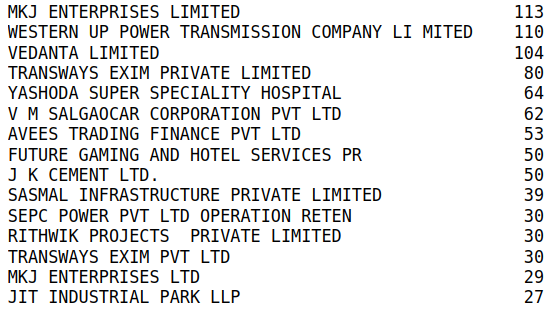
df.groupby(by='Name of the Purchaser')['Amount received'].sum().nlargest(20)
The result is shown below (the top 20 supporters of democracy!)
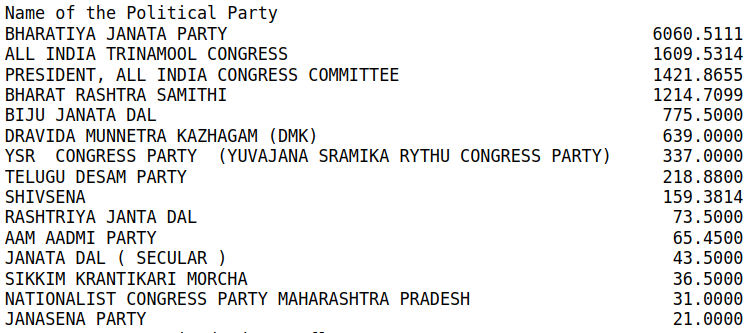
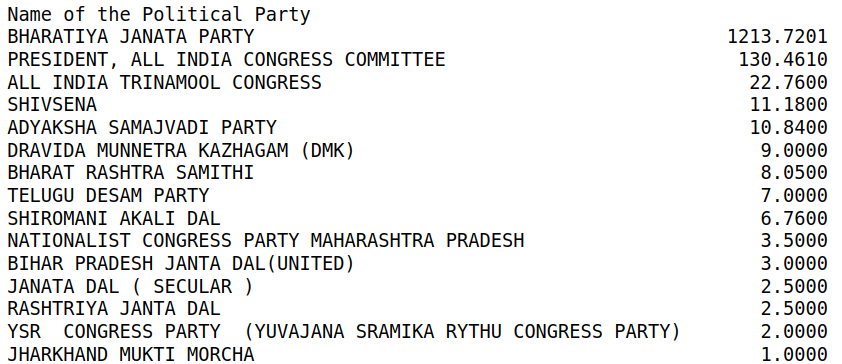
df.groupby(by='Name of the Political Party')['Amount received'].sum().nlargest(20)
The result is shown below
Now we select two major political parties and list their donors. This could be done in a more generic manner, but for the time being use the simple way. You can cross check using the CSV file created for each party.
bjp = combined[combined['Name of the Political Party'] == 'BHARATIYA JANATA PARTY']
#bjp.to_csv('bjp.csv')
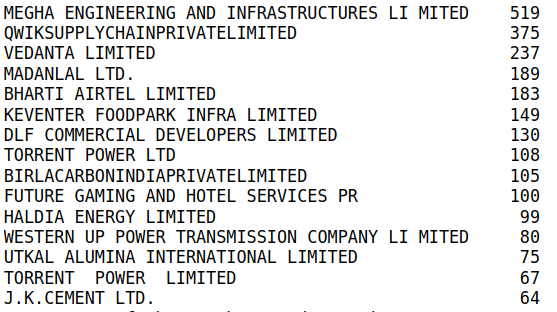
bjp.groupby(by='Name of the Purchaser')['Amount received'].sum().nlargest(15)
This will print the top 15 donors of BJP, as shown below.
inc = combined[combined['Name of the Political Party'] == 'PRESIDENT, ALL INDIA CONGRESS COMMITTEE']
#inc.to_csv('inc.csv')
inc.groupby(by='Name of the Purchaser')['Amount received'].sum().nlargest(15)
# You may add more here
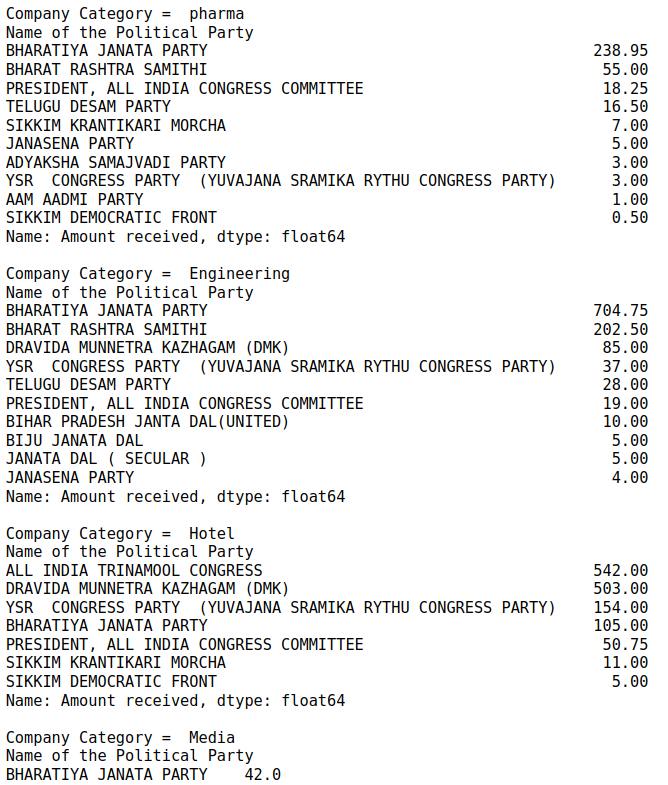
categories = ['pharma', 'Engineering', 'Hotel', 'Media']#, 'Infra', 'Construction', 'Energy', 'Mining', 'cement']
for cat in categories:
f1 = df[df['Name of the Purchaser'].str.contains(cat, na = False, case = False)]
print('Company Category = ', cat)
print(f1.groupby(by='Name of the Political Party')['Amount received'].sum().nlargest(15))
print()
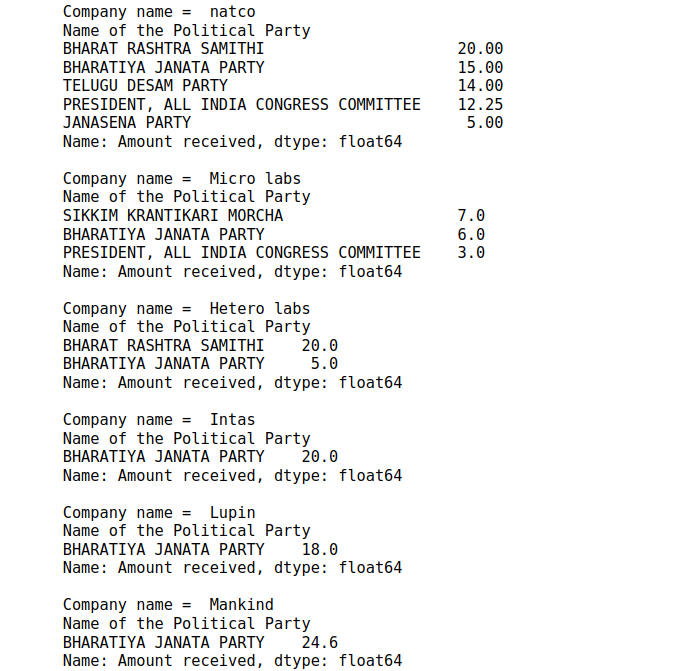
The company names are taken from a report on The Hindu on 19-Mar-2024.
names = ['natco', 'Micro labs', 'Hetero labs', 'Intas', 'Lupin', 'Mankind']

for s in names:
    firm = df[df['Name of the Purchaser'].str.contains(s, na = False, case = False)]
    print('Company name = ', s)
    print(firm.groupby(by='Name of the Political Party')['Amount received'].sum().nlargest(5))
    print()
Let’s learn how Pandas handles Date and Time data. We will select the data during the period from 12-Apr-2019 to 10-may-2019 and have a look at the fund distribution.
df['DateTime'] = pd.to_datetime(rdf['Date of Encashment'])
start_date = '2019-04-12'    # 12-Apr-2019 to 10-May-2019 , before 2019 election
end_date = '2019-05-10'

# Select DataFrame rows between two dates
mask = (df['DateTime'] > start_date) & (df['DateTime'] <= end_date)
data2019 = rdf.loc[mask]
data2019.groupby(by='Name of the Political Party')['Amount received'].sum().nlargest(15)
Python file containing the code listed above first.py
Start learning Python and Pandas. Try more detailed analysis. Exploring a practical problem helps learning better.